Tuesday, March 9, 2010

Google's public data explorer - a cool key to unlock, integrate and present

Check out Google's public data explorer. If this looks familiar, it is. Google acquired this innovative charting method from Hans Rosling sometime in 2008 (seems so long ago). You can look at the original versions of this charting method at www.gapminder.org that blew us away when we first saw Mr. Rosling's TED talks about "his datasets changing our mind sets" last summer. (http://www.ted.com/talks/lang/eng/hans_rosling_at_state.html)

As we continue to expect to see with Google - they are integrating these very cool charting techniques with their other disruptive offerings like Google docs. They are effectively dismantling the barriers that exist with publishing an interactive/animated graph that can transform your datasets into somewhat of a data-visualization art form that, if done right, can really tell mind-blowing stories. If you can run an excel spreadsheet, you're overqualified to use Google Docs - give it a try. Just "google" "google docs" to find out more.

We hope to leverage these datasets from the public data explorer and new integrated tools to continue to explore effective ways of how health-data can be transformed to meaningful information to increase and enhance our knowledge - the first step towards action.

Google's public data explorer can be found here: http://www.google.com/publicdata/home

Happy exploring.

PS: who things there are too many "google's" in this post?

Monday, March 8, 2010

share your ideas @ myhealthinnovation.com

ever had an innovative idea to improve, enhance or revolutionize your healthcare experience? well now you have a voice and an audience to "share, vote and say thanks for low-cost, low-tech ideas".

my health innovation is a great use of web2.0 - stitching together near ubiquitous technology and platforms to allow everyone to innovate and cause change - great job!

excerpt from http://myhealthinnovation.com/about_myhealthinnovation:

What would make your experience with the health care system amazing? Perfect? The purpose of an "Innovation Cell" − the research unit behind Myhealthinnovation − is to collect your innovative ideas and get hospitals, caregivers and patients to use them. We want to make the experience of health care as close to perfect as possible. Yes, it's ambitious. We know you've got great ideas − because you either have, or will, encounter the health system some day. That's why we created this Web site.

Any visitor can look at the ideas that have been posted in “Ideas in Action” – simple, low-tech ideas to improve health care in local communities and around the world. Anyone can also submit their own ideas, vote and comment on ideas submitted by other people. You can also visit the THANKbook to say thanks to others whose ideas – posted on this site or elsewhere – have improved your life for the better.

Tuesday, March 2, 2010

the cost of getting sick - a visualization from GE

Another innovative, interactive and "cool" way of illustrating some complex information on the cost of chronic conditions.

Thursday, February 25, 2010

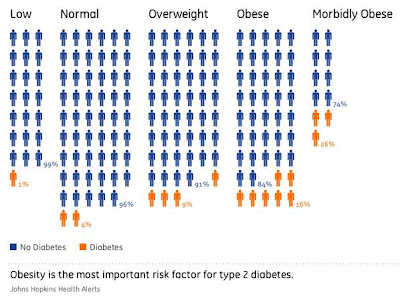
the health visualizer - take a new look at health from GE

this simple but powerful tool helped to inspire the launch of this project.

a pretty cool and creative way to illustrate a fairly large amount of data - give it a try. Compare Body-Mass-Index (BMI) with Diabetes - you can really see how much BMI weighs in as a risk factor.


http://www.ge.com/visualization/health_visualizer/

the first entry

Its 9:30p EST on Feb 25th, 2010.
Location: Canada\Ontario\Toronto
Things to do:
  1. launch this project - done.
  2. tell the world about it - in progress.
  3. keep learning - ongoing.
  4. do more....
The Health Data Project Team.
Member 1 of 1